How out-of-home impressions are measured, and why moving screens are different

An out-of-home impression is a modelled estimate of how many people likely noticed an ad, not a recorded event. Geopath builds it from circulation past a display at an audited fixed location, reduced by a visibility adjustment. Four of the five visibility inputs describe that location, which is why moving inventory needs a different chain.
Out-of-home is the only major medium where the audience number is an estimate of human attention rather than a log of a server event. No one clicked. No device reported back. The number exists because a measurement body modelled it, and every model carries assumptions about the thing being measured.
Those assumptions are the subject of this page. They are also where mobile inventory quietly falls out of the standard framework, which the pages ranking for this question do not mention, because every one of them is published by a company selling fixed screens or the software that trades them. This is the measurement desk of a site about out-of-home advertising written from the moving screen.
What is an out-of-home impression?
Geopath, the audience measurement body for out-of-home in the US, defines impressions as "the total number of times people passing an OOH display are likely to notice the ad," over a 12-hour, 18-hour or 24-hour day depending on whether the unit is lit.
Two words in that sentence carry the whole medium. Passing: the audience is the one in motion. Likely: this is a probability, not a count. An out-of-home impression is a modelled estimate of noticing, and treating it as equivalent to a digital ad impression is a category error that produces confident, wrong media comparisons.
Circulation is not an audience
The number most often quoted in a sales deck is not the impression figure at all. It is circulation, which Geopath defines as "a measurement of traffic volume in a market" that "only estimates the number of people with an opportunity to see an Out of Home display and, therefore, is no longer a credible measure of an Out of Home audience." The glossary entry for Daily Effective Circulation adds that DEC figures "are no longer endorsed as a buying and selling currency by the members of Geopath."
So a vendor who tells you a corner "sees 40,000 vehicles a day" has told you a circulation count, on the measurement body's own definition an input rather than a result. It is not wrong. It is the wrong number for the question you asked.
How is the number actually built?
Three steps, each of which can be interrogated. They are laid out in Geopath's own methodology summary, and the first thing that summary says is the part that matters most here: every unit in the ratings database is "audited using GIS and GPS data" to record "each panel's attributes and precise location." The chain starts from a coordinate.
Step 1: Circulation at the location
The starting figure is Daily Effective Circulation: "the total number of persons, in cars or other vehicles, passing and potentially exposed to an advertising display" over the stated period. Geopath says it is derived from "standardized counts of vehicle and pedestrian volume, bus and train ridership, and transit station traffic," and that the sources are "generally government resources like the local Department of Transportation or local Transit Authorities." In plain terms: a traffic count at a fixed point on a road.
Step 2: Visibility adjustment
Circulation counts people who went past. Most of them noticed nothing. The Visibility Adjustment Index is Geopath's correction: "the percentage of a unit's total OTS audience (circulation) who are likely to notice an ad." The glossary says VAIs come from Geopath's visibility study and take into account "common board characteristics, size, road side, distance from the road, road type, and illumination," and adds that "VAIs are not measures of audience." They are properties of the unit and its placement.
Step 3: From opportunity to likelihood
Geopath's glossary says Opportunity to See "is today's standard for reporting ratings for all media types except Out Of Home," and that out-of-home "is the first medium in the US to move from reporting OTS audiences (circulation) to LTS (Likely to See) audiences." Likelihood to See is "the portion of the OTS audience who are likely to see an ad." That shift is the difference between counting who drove past a structure and estimating who registered what was on it.
Reach and frequency sit on top: reach is the share of a target population who notice the message at least once, frequency the average number of times they notice it, typically over four weeks.
Why does a moving screen break this chain?
Look again at what feeds the visibility adjustment: size, road side, distance from the road, road type, illumination. Four of those five describe where the structure stands. They are stable because the structure is bolted down, and the audit that opens the whole process records that fixed position.
Put the same ad surface on a vehicle and four of the five inputs stop being values and become distributions.
| Visibility input (Geopath) | Fixed panel | Vehicle-mounted surface |
|---|---|---|
| Board size | Constant. Measured once, applies for the life of the unit. | Also constant. The one input that transfers unchanged. |
| Road side (position relative to traffic) | A fixed property of the site: which side of the road, what angle to traffic. | Changes continuously. The unit is in traffic, not beside it. |
| Distance from the road | A fixed setback, measurable in advance. | A distribution, not a number. Depends on lane, traffic density and relative speed. |
| Road type | One road, one classification. | A route crosses several road types in a single shift. |
| Illumination | A property of the structure and its hours. | Transfers for screens; wraps and static tops depend on ambient light along the route. |
The circulation step inverts too. DEC counts people passing a display at a point where a transportation agency has a counter. For a vehicle, the display passes the people, so the equivalent question is not "how many go past this point" but "how many points does this unit go past, and who was at each of them." No agency publishes a traffic count for a route that changes by the hour.

What replaces those inputs for mobile inventory?
Structurally, four things do the work that location does for a fixed panel:
- Route: which areas the unit travels through, and in what sequence.
- Dwell: how long it stays within a given zone, including time spent stationary in traffic or parked at a venue.
- Speed: how long any given viewer has the surface in view.
- Time of day: who is present along that route at that hour.
Notice what changes for the planner. On a fixed panel, geography is fixed at booking and cannot be adjusted. On mobile inventory, geography is an input you set, which means it can be planned deliberately, and also means an impression figure is meaningless unless the route it assumed is stated alongside it. That planning consequence is the subject of location-based advertising.
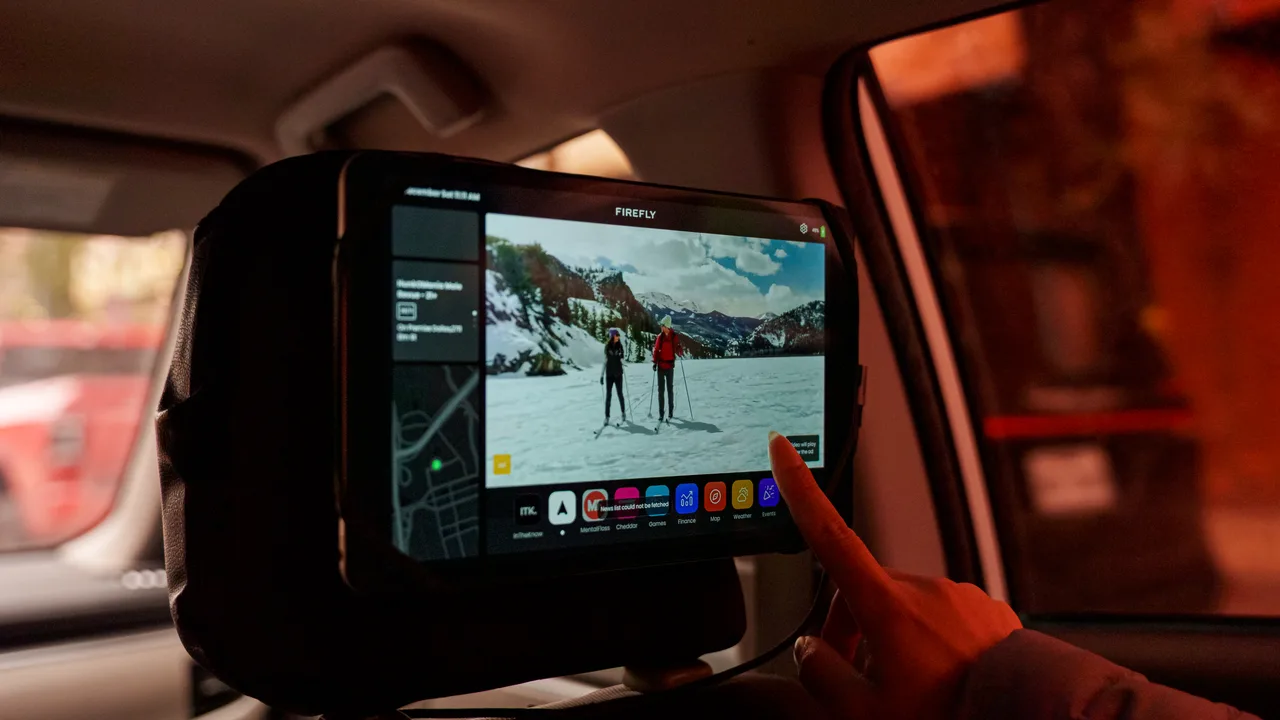
Operators that publish a measurement offer for this inventory publish it as studies, not as a rated figure. Firefly, the operator behind the studies cited on the brand lift and incrementality pages, lists brand study, foot traffic, web conversion, app conversion and retargeting on its measurement page and describes its digital tops as GPS-equipped, which is what a route log is read from. Ask any operator for the same two things: the method behind the study and the log behind the route.
Frequency behaves differently for the same reason. A fixed panel accumulates frequency passively: the same commuters take the same road every morning, whether or not the campaign wanted that repetition. Mobile inventory can rotate routes to spread exposure across more people, or hold a route to concentrate it. Neither is better; they answer different briefs.

Is there a single standard for measuring moving inventory?
Not in the way there is for fixed panels. Geopath's glossary does recognise mobile formats. It defines a mobile billboard as "a truck equipped with one or more poster panel units" that "can either be parked at specified venues or driven around designated localities." But the visibility framework that produces a comparable impression number was built around structures with a precise, audited location.
The framework is also being replaced. On March 31, 2026, Geopath, in partnership with OAAA, announced it had selected Ipsos to support an industry pilot launching in the second half of 2026 for a next-generation measurement system "across multiple formats and environments, including updated methods for estimating impressions, reach, and frequency." The two organisations anticipate a transition from the current Geopath system "beginning in 2027" and "full adoption in 2028." Every impression figure quoted today is on the outgoing method.
So the honest answer is that mobile impression figures vary by who produced them and on what assumptions. That is not a reason to discount the format. It is a reason to ask for the method before accepting the number, and to stop putting a fixed-panel figure and a mobile figure in adjacent columns of the same spreadsheet as though they were measuring the same thing. When mobile inventory is bought programmatically the same caution applies to the impression the platform bills against, which is covered on programmatic DOOH.
What a delivery report for a moving unit has to state
If a vendor's report for vehicle-mounted inventory does not carry all five of these, the impression figure on it cannot be checked by anyone, including the vendor.
- The route or zone actually driven, not the one planned. Screen units are normally GPS-tracked; ask for the log.
- Hours in service per unit per day, and hours stationary.
- The audience source used to populate that route (mobile location panel, transit ridership, agency traffic counts) and its date.
- The visibility assumption, and whether it was derived for this format or borrowed from a fixed-panel study.
- Which side of the unit the figure counts. A two-sided taxi top and a three-screen truck are not one surface.
This site publishes no impression counts and attributes no multiplier to any operator. It is a reference on how the numbers are built, and the archive behind it exists so that "show me the campaign" has a documented answer rather than a render.
What impressions do not tell you
Every step above is about delivery: how many people could plausibly have noticed. None of it says whether they remembered the brand, or changed their mind about it. That is a different instrument, a controlled survey of exposed and unexposed groups, with its own design faults and its own vendors. It is covered on brand-lift studies. Whether behaviour changed against a counterfactual, the third question, is incrementality testing. Delivery numbers and lift numbers get pasted into the same slide often enough that it is worth saying plainly: one counts eyes, the other asks minds.
What should you ask before accepting an impression number?
- Who produced it? An independent measurement provider, or the company selling the space?
- What were the inputs? Circulation source, visibility assumptions, time period.
- Was the method designed for this format? Fixed-panel methodology applied to a moving unit is a mismatch, however precise the output looks.
- For mobile: what route was assumed? Without it the figure has no geography, and geography is the variable.
- Is it reach or impressions? They are different numbers and get quoted interchangeably by people who should know better.
Where to go next
For the formats these numbers describe and how each is bought, see the guide to out-of-home advertising. For who produces measurement and why the seller is rarely the right source for it, see how the out-of-home market is structured. For the moving formats themselves and who regulates each one, see transit advertising.
Frequently asked questions
- What is an OOH impression?
- Geopath defines impressions as the total number of times people passing an out-of-home display are likely to notice the ad, over a 12, 18 or 24-hour day. The key word is "likely". An impression is a modelled probability of noticing, not a recorded event like a page view or a click.
- How are OOH impressions measured?
- From circulation past a fixed location (vehicle and pedestrian counts, bus and train ridership, usually from a state or local transportation agency), reduced by a Visibility Adjustment Index that reflects the unit's size, road side, distance from the road, road type and illumination. Geopath audits every unit in its database with GIS and GPS data at its precise location before any of that is applied.
- What is the difference between circulation and impressions?
- Circulation is a count of traffic volume past a location. Impressions are the share of that traffic likely to notice the ad. Geopath's glossary says circulation "only estimates the number of people with an opportunity to see" a display and is "no longer a credible measure of an Out of Home audience." A vendor quoting circulation as audience is quoting the wrong number.
- What is the difference between OTS and LTS?
- Opportunity to See counts people who passed a display and could have seen it. Likelihood to See is the portion of that group likely to have noticed the ad. Geopath says OTS remains the reporting standard for every medium except out-of-home, which reports LTS instead.
- What is Daily Effective Circulation (DEC)?
- Geopath defines DEC as the total number of persons, in cars or other vehicles, passing and potentially exposed to an advertising display over 12, 18 or 24 hours. It is the starting input before any visibility adjustment. The same glossary entry says DEC figures are no longer endorsed as a buying and selling currency by Geopath's members.
- Are impressions for mobile billboards and vehicle screens measured the same way?
- Not cleanly. Four of the five visibility inputs (road side, distance from the road, road type, illumination for printed surfaces) are properties of a fixed site, and the circulation count is taken at a fixed location. A unit that travels has no single value for any of them, so a fixed-panel figure and a mobile figure are not directly comparable line items.
- What does 1,000 impressions mean in out-of-home?
- It is the unit behind CPM. Geopath defines a ratings-derived CPM as the cost of delivering 1,000 impressions from people who see the advertising on displays in a market, as opposed to 1,000 opportunities to see. This site publishes no rates; the point is that a CPM cannot be checked without the impression count and the method behind it.
- How do reach and frequency work in out-of-home?
- Reach is the share of a target population who notice the message at least once; frequency is the average number of times they notice it, typically over four weeks. Fixed sites generate frequency passively, because the same commuters repeat the same routes. Moving inventory changes frequency by changing where it goes.
- What should I ask a vendor about their impression numbers?
- Three things: which measurement provider produced the figure, what the inputs were, and whether the method was designed for the format being sold. For a moving unit, add a fourth: what route and hours the figure assumes. A number with no stated method is a sales figure, not a measurement.
Sources
- Glossary: circulation, daily effective circulation, impressions, visibility adjustment index, OTS, LTS, reach, frequency, CPM · Geopath, Accessed September 14, 2026
- Geopath Research Methodology: Measuring Out of Home Audiences (audited database, circulation sources, visibility research) · Geopath, Accessed September 14, 2026
- OOH industry advances effort to modernize audience measurement and selects Ipsos for pilot program · Geopath, March 31, 2026
- Out of Home Advertising Revenue Reaches Record $9.46 Billion · Out of Home Advertising Association of America (OAAA), March 17, 2026
- Measurement & Attribution: brand study, foot traffic, web conversions, app conversion, retargeting · Firefly, Accessed September 14, 2026
About the author
Ercan Bozkurt writes the methodology pages on this site: how out-of-home inventory is counted, measured and bought, with a particular interest in screens that move. He works from the primary document in each case, the transit authority's own rulebook, the measurement body's own definitions, the company's own filing, and writes the page so that a media planner can check every figure against it.
Ercan Bozkurt on LinkedIn · Reviewed by Melih Koray, who publishes this site · How this site is edited and what it refuses to publish: about this site.