Brand lift study, explained: how out-of-home brand lift is actually measured
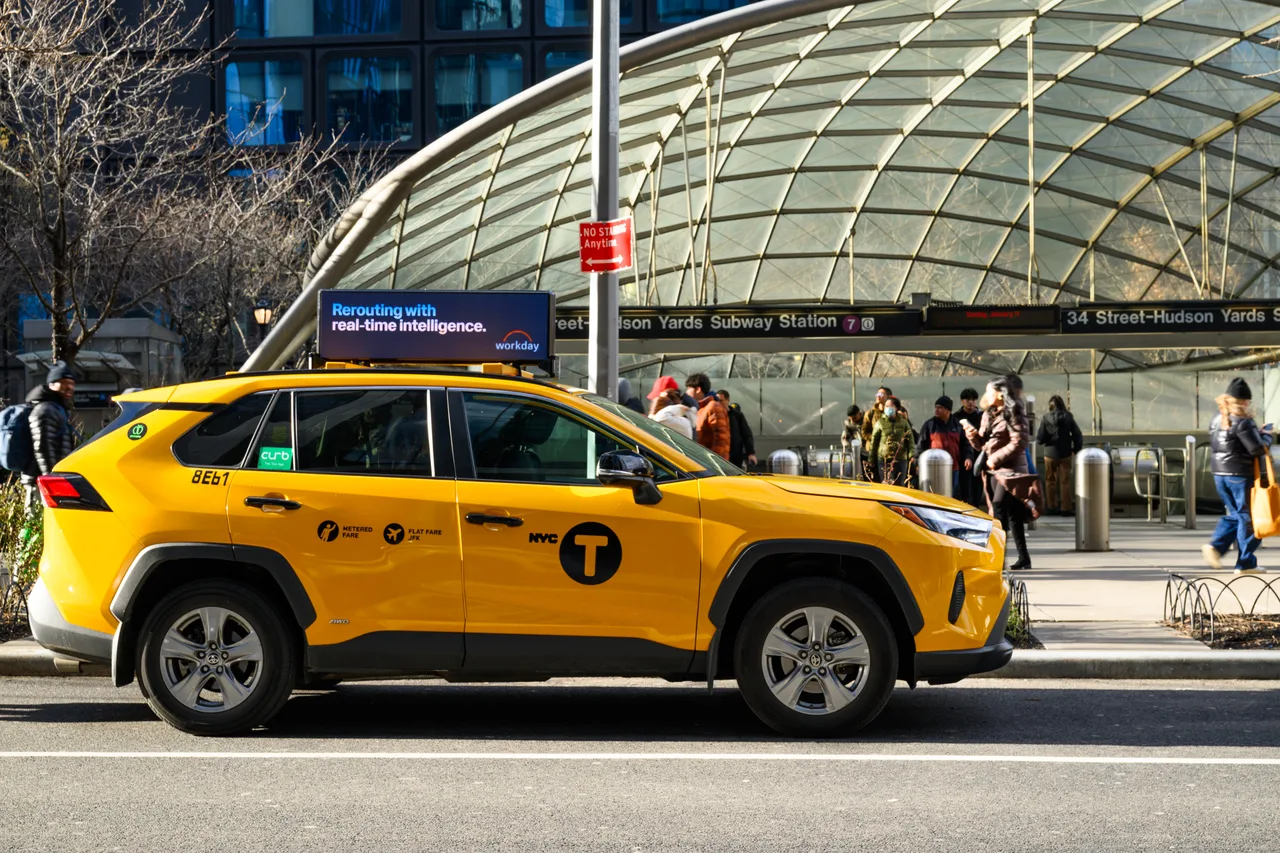
A brand lift study measures the difference in brand attitudes between people exposed to a campaign and a comparable group who were not, using a survey. For out-of-home, exposure has to be constructed, usually from device location, rather than read from an ad server, so the exposure definition and the control method come before the lift figure.
Out-of-home has no click, so its proof of effect comes from the brand lift study: a survey comparing people exposed to the campaign with people who were not. The idea is simple. The execution, in a medium where nobody logs the exposure, is where the useful questions are: what counts as exposed, where the control group comes from, how many respondents a lift needs, and what published results look like once the units are read.
What is a brand lift study?
A brand lift study is a survey-based comparison of two groups: people exposed to a campaign and a control group who were not. Both answer the same questions about the brand, and the gap between their answers is the lift. Cint's Lucid Measurement defines it exactly that way: a control percentage, an exposed percentage, and the difference between the two.
The questions cluster into five metrics; Kantar's LIFT Express lists awareness, favourability and purchase intent, Google's Brand Lift adds ad recall, association and consideration.
| Metric | The question behind it | What movement means |
|---|---|---|
| Ad recall | Do you remember seeing advertising for this brand recently? | The campaign was noticed. Aided and unaided are different questions. |
| Brand awareness | Which brands in this category come to mind? Have you heard of this one? | The brand entered the set. Top-of-mind, unaided and aided are reported separately. |
| Favourability | How do you feel about this brand? | Attitude shifted, reported as the share answering positively. |
| Consideration | Would you consider this brand next time you buy in the category? | The brand made the shortlist. |
| Purchase intent | How likely are you to buy this brand? | The nearest thing to a sales proxy, and still a stated intention. |
Two conventions for reporting the gap, and vendors mix them. Absolute lift is the difference in points; relative lift divides it by the control group's score. Cint's worked example: 52.39% of the control group aware, 55.05% of the exposed group, an absolute lift of 2.66 points, a relative lift of about 5%. A result quoted as +40% is almost always relative. Ask for both base rates; without them a percentage cannot be turned back into people.
How is exposure established for out-of-home?
Nothing in out-of-home records an exposure, so the exposed group has to be constructed. Three methods are in use: device location, where a phone observed inside a placement's viewshed marks its owner as exposed; claimed recall, where respondents who say they saw the ad form the exposed group; and modelled audiences, which estimate how many people were likely to notice but cannot name any of them.
Device location
The OAAA's measurement guide (March 2020) defines exposure as presence in a screen's exposure zone, or viewshed, while content is viewable, and notes that this does not require the content to have been seen. OUTFRONT Media's explainer (May 2024) gives the mechanics: measurement partners geofence the viewshed, a phone passing through is marked present by its mobile advertising identifier, and opted-in consumers from that set are surveyed.
Reveal Mobile, the exposure partner LoopMe named for out-of-home in May 2025, describes computing device-level exposure from media plans, ad rolls, experiential specs and moving waypoints, joined spatiotemporally to a persistent panel of 60 million US daily active users. LoopMe runs non-incentivised mobile surveys against that data. That is the device-based pattern in one sentence: a location panel supplies the exposed group, a survey vendor supplies the questions.
Claimed recall
Happydemics, which reports more than 1,300 DOOH studies since 2021, shows respondents the ad, asks whether they recall seeing it on a specific channel, and compares those who do with a control group. That measures the difference between people who remember the ad and people who do not. Memory correlates with attention and with existing affinity for the brand, so a recall-defined lift and a device-defined lift are not the same number, even for the same campaign. Both are legitimate. Label which one you have.
Modelled audience
Geopath impressions are the third thing, and the one most often confused with the first. Geopath defines impressions as the number of times people passing a display are likely to notice the ad; circulation only estimates opportunity to see, and Visibility Adjustment Index values "are not measures of audience". The model draws on aggregated data from more than 150 million mobile devices (Geopath's 2019 standards document), but its output is an audience estimate, not a roster of exposed people. It sizes the audience. It does not produce a survey sample. How the estimate is built, and why it changes for a moving unit, is on how out-of-home impressions are measured.
When the screen moves
On a fixed site the viewshed is a polygon drawn once. On a vehicle it travels with the unit, so exposure stops being a property of a place and becomes a distribution over the route, the hours and the dwell along it. Reveal's method acknowledges this by listing moving waypoints as an input. The consequence is that the exposed group is only as good as the route log behind it: two campaigns with identical impression counts can have entirely different exposed panels, one concentrated on a commuter corridor, the other spread thinly across a city. A lift study on inventory whose geography is a route should be briefed with the route data, not just the impression total. Firefly, whose LoopMe-measured taxi-top study is the third row of the results table below, lists brand study first among five offerings on its measurement page, with foot traffic, web conversion, app conversion and retargeting; the route log behind an exposed panel is the operator's to supply, so ask for it in the brief.
How is a control group built when nobody can be held out?
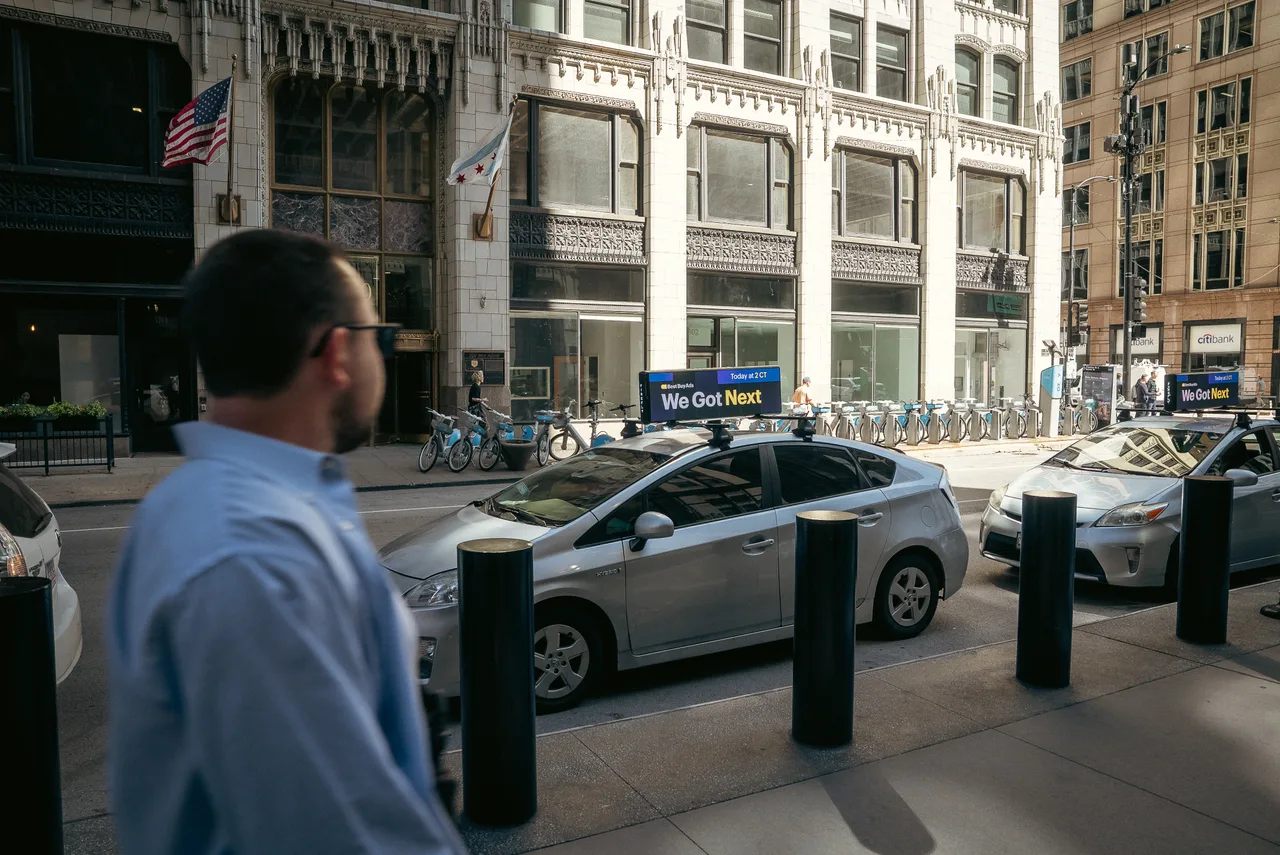
Out-of-home cannot serve a public-service message to a control group the way a digital campaign can, so the control is constructed after the fact. Four methods are in use, each answering a slightly different question, and the vendor should name which one it used.
| Method | How the control is built | Watch for |
|---|---|---|
| Matched respondents | Respondents not observed in the viewshed, matched or weighted to the exposed group. LoopMe calls its version proprietary control group matching. | "Not observed" is not "not exposed". A phone reporting no location can still walk past the screen. |
| Synthetic control | A counterfactual group built by propensity-score matching. Reveal Mobile describes users "identical to the exposed group, except for the fact that they were not exposed". | Only as good as the variables matched on. Ask which ones. |
| Geographic holdout | Whole markets go dark. Google's 2011 geo-experiment method randomly assigns non-overlapping regions to treatment or control; Meta's GeoLift builds a synthetic control from untreated locations. | Needs several comparable markets and a clean pre-period. One market has nothing to hold out. |
| Pre/post | The same population surveyed before and after the flight. The OAAA guide allows lift "versus the control group or before the ad buy occurred". | Everything else that happened in the period is inside the number. |
The quiet problem is that an out-of-home control group is defined by absence of evidence. A device is in the control because it was not seen in the viewshed, and location panels are samples: 60 million daily active users is large and still not everyone. Some of the control was exposed and never logged. That pushes measured lift down, a conservative bias but a bias, and it is why the OAAA guide asks providers whether there is panel bias and whether data is normalised to census.
How large does the sample need to be?
Large enough that the margin of error is smaller than the lift. Cint's significance FAQ spells out the test: a two-tailed z-test on the difference in proportions, with the margin of error equal to the z-score for the chosen confidence level times the standard error. Margin smaller than absolute lift means significant. Cint defaults to 90% and calls 80% results directional.
Run that arithmetic on an ordinary study. Control at 40% aided awareness, exposed at 43%, 250 respondents per cell: the standard error of the difference is about 4.4 points and the 90% margin about 7.3 points, more than twice the lift. The same three points need roughly 1,500 per cell to pass 90% and just over 2,000 to pass 95%. A ten-point lift passes at 250. Small lifts on small samples are noise; large lifts on small samples are the ones worth checking for a broken control.
| Vendor | Stated threshold | Where it says so |
|---|---|---|
| Cint (Lucid Measurement) | Two-tailed z-test; 80%, 85%, 90% and 95% supported; defaults to 90%. Results at 80% are called directional, at 90% more actionable. | Statistical significance FAQ, November 2025 |
| Google Ads Brand Lift | 80% two-sided confidence interval, read as a 90% chance the lift exceeds the lower bound. Lift detectable at about 2,000 responses per metric for strong campaigns, 4,100 at the recommended minimum budget; lifts under 2% need more. | Google Ads Help, accessed September 2026 |
| Reveal Mobile | 95% statistical confidence stated for every campaign, with confidence intervals and p-values from closed-form formulas and simulations. | Net Lift methodology page, accessed September 2026 |
Three vendors, three thresholds. A lift reported without one is a number, not a finding.
What does a good out-of-home brand lift result look like?
Published out-of-home results range from a 13.3% average across thousands of studies to lifts above 40% in single-campaign case studies, and an average and a single campaign are not the same kind of number. The table lists the named, dated results this desk could verify against the publisher's own page.
| Study | Measured by | Scope | Reported result |
|---|---|---|---|
| RADARProof studies, Clear Channel Outdoor with Kantar | Kantar | Five-year review of thousands of studies across categories; published July 2025, restated May 2026. | OOH averaged 13.3% growth in ad awareness, against 10.2% for TV, 3.9% for digital and 2.2% for connected TV. On favourability and purchase intent, OOH "matches linear TV". |
| Science in Motion, Vistar Media with Omnicom Media and JCDecaux | Vistar Media research; no separate measurement firm named | Controlled creative study, 7,513 respondents, November 2025 to January 2026; published May 2026. | 3D creative: 10% uplift in top-of-mind awareness against a control group. Static creative: 38% uplift in aided ad recall. Motion averaged 33% higher ad recall and 50% higher awareness than static. |
| Digital taxi-top campaign for a cosmetics brand, published by the operator (Firefly) | LoopMe | 39,981,921 impressions across Chicago, New York, Los Angeles and Miami against a 30,000,000 target; published November 2024. | Among exposed audiences: brand awareness +43%, brand recall +44%, favourability +46%, purchase intent +85%. |
Read the third row against the first. A +43% from one campaign and a 13.3% average across thousands are not comparable, and the case study, like most operator case studies, publishes lifts without base rates or sample per cell, so the figures cannot be converted into points or confirmed as relative. That is normal for the genre, and it is the reason to ask for base rates before a result goes into a deck. For scale, Cint's example of a typical US digital campaign is a 2.66-point absolute lift in awareness.
Brand lift, incrementality and attribution are three different questions
Brand lift measures a change in what people think. Incrementality measures a change in what they do that would not have happened without the campaign. Attribution assigns credit for an outcome to touchpoints. The OAAA guide draws the line explicitly: measurement summarises plays, impressions, reach and frequency, while attribution "utilizes in-flight and post-campaign analytics to demonstrate causality or correlation".
| Brand lift | Incrementality | Attribution | |
|---|---|---|---|
| Question | Did perception move? | Did the campaign cause visits or sales that would not otherwise have happened? | Which touchpoints get credit for an outcome that did happen? |
| Method | Survey, exposed versus control | Test versus control on behaviour: matched devices, geographic holdout, synthetic control | Rules or models applied to logged touchpoints |
| Output | Points or relative lift on attitude metrics | Net lift on visits, sales or app actions | A share of conversions per channel |
| Weak point for OOH | The exposed group has to be constructed | Needs a clean holdout; hard in a single market | No logged touchpoint unless a device panel supplies one |
Meta's GeoLift documentation states the incrementality definition plainly: the difference between what was observed and what would have happened had the campaign not run. Programmatic buys report delivery by screen and hour, the exposure log an incrementality model needs; direct buys usually have to reconstruct one (see programmatic DOOH). Incrementality testing gets its own page on this site, incrementality testing; the short version is that it moves the question from attitudes to behaviour and inherits every exposure problem above.
How do you brief a brand lift study?
Brief the exposure definition, the control method, the sample per cell, the confidence level and who is paying, in writing, before the flight starts. A study designed after the campaign has no pre-period, no route log and nothing left to hold out.
- Exposure definition. Device observed in a viewshed, claimed recall, or modelled? For moving inventory, what route data defines the viewshed, and who supplies it?
- Control construction. Matched respondents, synthetic control, geographic holdout or pre/post, and which variables were matched on.
- Sample per cell, not in total. Exposed and control separately, and again for any cut you intend to report.
- Confidence level and test. 80, 90 or 95%, one- or two-sided, and whether results below the threshold will still be reported as lifts.
- Base rates. Control and exposed percentages for every metric, so absolute and relative lift can both be computed.
- Survey timing. When it runs relative to the flight, unaided before aided, and whether the creative is shown.
- Who pays and who runs it. A study the media owner funds and staffs is still useful; label it as such, and hold the raw crosstabs.
- Which benchmark. Norm set, channel, period, and whether the norm is a range or a point. Cint publishes a 95% interval around each benchmark and says to treat it as a range.
The OAAA guide's 2020 question list covers most of this in different words: is a control group utilised, how are baseline and lift determined, how are dwell time and exposure calculated, is there panel bias. Six years old and still the right list.
Where to go next
The category these studies measure is laid out in the guide to out-of-home advertising. The impression chain a lift study sits on top of, and why it changes when the screen moves, is on how out-of-home impressions are measured.
Frequently asked questions
- What is a brand lift study?
- A survey-based comparison between people exposed to a campaign and a control group who were not. Both answer the same questions about the brand, and the difference in their answers, in percentage points or as a relative percentage, is the lift. It measures perception: recall, awareness, favourability, consideration and purchase intent.
- How do brands measure brand lift from OOH campaigns?
- By constructing an exposed group after the fact, since no server logs an out-of-home exposure. The common method is device location: phones observed inside a geofenced viewshed of the placement are surveyed as exposed, and a matched or synthetic control is built from devices that were not. Some vendors instead define exposed as respondents who recall the ad. The two are not comparable.
- How is brand lift calculated?
- Absolute lift is the exposed group's score minus the control group's score, in points. Relative lift divides that gap by the control score. Cint publishes the worked example: 52.39% of a control group aware, 55.05% of the exposed group, an absolute lift of 2.66 points and a relative lift of about 5%. Results quoted as +40% are almost always relative.
- How many respondents does a brand lift study need?
- Enough that the margin of error is smaller than the lift. On a 40% baseline, a three-point lift needs roughly 1,500 respondents per group to pass a 90% two-sided test and just over 2,000 to pass 95%; at 250 per group the margin is about seven points. Google says lift in its own studies becomes detectable at about 2,000 to 4,100 responses per metric.
- What is a good brand lift for out-of-home advertising?
- It depends on the unit. Clear Channel Outdoor and Kantar report an average 13.3% growth in ad awareness across thousands of OOH studies. Single-campaign case studies publish lifts of 40% and more, such as a LoopMe-measured taxi-top campaign reporting +43% awareness and +85% purchase intent, usually without the base rates that would make them comparable.
- What is the difference between brand lift and incrementality?
- Brand lift measures a change in what people think, through surveys. Incrementality measures a change in what they do, such as store visits or sales, that would not have happened without the campaign, through a test-and-control design on behaviour. Attribution is a third thing: assigning credit for an outcome to touchpoints. The OAAA treats measurement and attribution as separate disciplines.
- Can brand lift be measured for moving screens such as taxi tops?
- Yes, and it has been, but the exposure definition changes. A fixed site has one viewshed; a vehicle's viewshed travels with it, so exposure is computed from the unit's route and timing. Reveal Mobile lists moving waypoints as an input to its exposure model, and a LoopMe-measured taxi-top campaign has published lift results. The exposed group is only as good as the route log.
Sources
- Benchmarks Campaign Performance: control %, exposed %, lift in points, 95% confidence interval around each benchmark · Cint (Lucid Measurement help centre), Published September 30, 2025, updated July 29, 2026
- Statistical significance FAQ: two-tailed z-test, 80/85/90/95% confidence levels, 90% default · Cint (Lucid Measurement help centre), November 7, 2025
- Kantar expands LIFT Express self-serve scalable brand lift measurement offer: awareness, favorability, purchase intent, Meaningful Different Salient · Kantar, June 9, 2026
- Understand Lift measurement statuses and metrics in Google Ads: absolute lift, confidence intervals, responses required · Google Ads Help, Accessed September 2026
- About certainty of lift · Google Ads Help, Accessed September 2026
- Out of Home Advertising: Measurement and Analytics Guide for Agencies and Advertisers · Out of Home Advertising Association of America (OAAA), Data Use and Analytics Committee, March 2020
- OOH FAQ: Billboard and Transit Media Measurement and Attribution · OUTFRONT Media, May 21, 2024
- OOH Performance Measurement: The Net Lift Study, exposure, control construction and confidence · Reveal Mobile, Accessed September 2026
- LoopMe and Reveal Mobile expand partnership to power global brand lift measurement for the out-of-home industry · LoopMe, May 6, 2025
- Unlock the power of DOOH: from attention to action (methodology: recall-defined exposed group; 7,600 studies, 1,320 DOOH campaigns) · Happydemics, July 23, 2025
- Glossary: circulation, impressions, Visibility Adjustment Index, Likelihood to See · Geopath, Accessed September 2026
- Geopath Insights Best Practices, Standards, and Protocols: mobile device and connected car data inputs · Geopath, November 2019
- Measuring Ad Effectiveness Using Geo Experiments (Vaver and Koehler) · Google Research, 2011
- GeoLift Methodology: incrementality, quasi-experiments and synthetic control methods · Meta Open Source, Accessed September 2026
- New Kantar Study Shows Out-of-Home Advertising Outperforms Key Channels and Addresses Gaps in Modern Marketing Strategies · Clear Channel Outdoor, via PR Newswire, July 8, 2025
- Creative Quality Emerges as Key Factor in OOH Campaign Performance, New Analysis Finds (restates the 13.3% / 10.2% / 3.9% / 2.2% ad awareness figures) · Clear Channel Outdoor, via PR Newswire, May 7, 2026
- Vistar Media research reveals 3D motion creative is 67% more effective at driving brand awareness in DOOH campaigns (Science in Motion, 7,513 respondents) · Vistar Media, May 19, 2026
- Case Study: Boosting Key Brand Metrics with Firefly Digital Taxi/Rideshare Tops (LoopMe-measured) · Firefly, November 28, 2024
- Measurement & Attribution: brand study, foot traffic, web conversions, app conversion, retargeting · Firefly, Accessed September 14, 2026
About the author
Ercan Bozkurt writes the methodology pages on this site: how out-of-home inventory is counted, measured and bought, with a particular interest in screens that move. He works from the primary document in each case, the transit authority's own rulebook, the measurement body's own definitions, the company's own filing, and writes the page so that a media planner can check every figure against it.
Ercan Bozkurt on LinkedIn · Reviewed by Melih Koray, who publishes this site · How this site is edited and what it refuses to publish: about this site.